Power & Impact Scale - 2025 Update 9 months ago
Background
The biggest difference between our Hurricane analysis and others is the proprietary Power and Impact (P&I) Scale, which first was developed in 2008 and has undergone additional refinement since. The P&I Scale gives a more complete picture of the impacts that a hurricane will produce, most appropriately at landfall. Because of the tremendous complexities of tropical cyclones, it is unlikely that any scale can quantify a storm's impacts 100 percent of the time. We are attempting to improve describing a storm's total effects, but maximum effects within a storm and their uncertainty should be evaluated as part of any threat assessment.
The original Saffir-Simpson scale took into consideration a storm's pressure and wind speed. In modern times it has been replaced by the Saffir-Simpson Hurricane Wind Scale, which only gives information about the estimated maximum sustained winds. This leaves out important information about the impacts of the storm, often leading to confusing messaging from both experts and emergency managers. The P&I Scale incorporates additional factors, including subjective tweaks that can be made to the scale in real-time, most notably with the pressure tendency.
The Basics
As of 2025, the revised Power & Impact scale includes the following factors:
- Maximum Wind Speed
- The value is assigned based on the traditional Saffir-Simpson Scale.
- Maximum Wind Gust
- The value is assigned based on where the maximum gust value falls on the Saffir-Simpson Scale.
- Minimum Central Pressure
- The value is assigned based on the traditional Saffir-Simpson Scale.
- Wind Extent (see below)
- Radius of Hurricane Force Winds
- Radius of 50kt Winds
- Radius of Tropical Storm Force Winds
- Pressure Tendency (see below)
The P&I Scale builds on the original Saffir-Simpson Scale, using the Sea Level Pressure and Maximum Sustained Winds.
| Original Saffir-Simpson Scale | |||
| Strength | Maximum Sustained Wind Speed (kt) | Maximum Sustained Wind Speed (mph) | Pressure (mb) |
| Category 1 | 64-82 | 74-95 | > 980 |
| Category 2 | 83-95 | 96-110 | 965-979 |
| Category 3 | 96-113 | 111-130 | 945-964 |
| Category 4 | 114-135 | 131-155 | 920-944 |
| Category 5 | >135 | >155 | < 919 |
Variables also include the radius of Hurricane and Tropical Storm force winds. The reason for this is intuitive, as the greater the diameter of strong winds the more energy is available to increase wave action and enhance storm surge.
| Benchmarks for Radius of Sustained Winds | |||
| Strength | Hurricane Force Winds | 50-Knot Winds | Tropical Storm Force Winds |
| Level 1 | ~ 25 nm | ~ 40 nm | ~ 50 nm |
| Level 2 | ~ 50 nm | ~ 75 nm | ~ 100 nm |
| Level 3 | ~ 75 nm | ~ 115 nm | ~ 150 nm |
| Level 4 | ~ 100 nm | ~ 150 nm | ~ 200 nm |
| Level 5 | ~ 125 nm | ~ 190 nm | ~ 250 nm |
The 64 kt (hurricane) wind extent score is the total of the four quadrants (in nautical miles) divided by 100. The 50 kt wind extent score is the total of the four quadrants divided by 150. The 34 kt (tropical storm) wind extent score is the total of the four quadrants divided by 200. We also have a gust category that takes the wind gust value from the official track and assigns it to the closest Saffir-Simpson scale category to one significant figure.
Crucial to this scale is the use of significant figures to one decimal place. For instance, if you have a storm with a 985 mb pressure and 90 mph winds, the pressure factor gets assigned a 1.7, the wind factor gets a 1.7, and the wind gusts get a 2.0. So, they are averaged, and you also respect the wind gusts. This hypothetical storm, just using the Saffir-Simpson scale, would be a Category 1, not a 1.8. Well, it should be a 1.8 because its metrics are closer to a Category 2 than a Category 1. After all, a storm isn't a step-function in which a 5 kt increase in sustained wind speeds magically makes it that much more of a beast.
Before the six scores are averaged together, an adjustment is made to take into account the pressure tendency factor. In this way, pressure tendency is also an element of the P&I Scale, as rapidly deepening storms will have their P&I score increased. With a weakening storm, it's the opposite.
The Pressure Tendency Factor is simply the 12-hour pressure tendency divided by 12.
The reason for this is rapidly deepening storms are likely tightening up quickly with almost perfect alignment between the lower and middle levels of the atmosphere, promoting the transfer of the strongest winds from just above the surface down to the surface. Weakening storms are the opposite, as a weakening storm likely has competing processes occurring.
Example 1
Let's take Hurricane Katrina before its first landfall in Florida.
.png)
| Hurricane Katrina (2005) | ||
| Variable | Estimate | P&I Level |
| Maximum Sustained Winds | 75 mph | 1.0 |
| Maximum Wind Gusts | 90 mph | 1.8 |
| Radius of Hurricane Force Winds | 50/100 | 0.5 |
| Radius of 50-kt Winds | 90/150 | 0.6 |
| Radius of Tropical Storm Force Winds | 250/200 | 1.3 |
| Minimum Pressure | 985 mb | 1.7 |
| Pressure Tendency at Landfall | -15 mb/12 hours | +0.8 |
| Rating | 1.3 | |
So Katrina's first landfall on the P&I Scale was a Category 1.3. What about its rating on Sunday before its final landfall?
.png)
| Hurricane Katrina (2005) | ||
| Variable | Estimate | P&I Level |
| Maximum Sustained Winds | 160 mph | 5.2 |
| Maximum Wind Gusts | 195 mph | 5.8 |
| Radius of Hurricane Force Winds | 275/100 | 2.8 |
| Radius of 50-kt Winds | 375/150 | 2.5 |
| Radius of Tropical Storm Force Winds | 585/200 | 2.9 |
| Minimum Pressure | 908 mb | 5.4 |
| Pressure Tendency before Landfall | -30 mb/12 hours | +2.5 |
| Rating | 4.5 | |
The smaller radius of maximum winds is limiting it. How about at landfall in Louisiana?
.png)
| Hurricane Katrina (2005) | ||
| Variable | Estimate | P&I Level |
| Maximum Sustained Winds | 150 mph | 4.8 |
| Maximum Wind Gusts | 185 mph | 5.6 |
| Radius of Hurricane Force Winds | 310/100 | 3.1 |
| Radius of 50-kt Winds | 385/150 | 2.6 |
| Radius of Tropical Storm Force Winds | 730/200 | 3.7 |
| Minimum Pressure | 915 mb | 5.2 |
| Pressure Tendency at Landfall | +10 mb/12 hours | -0.8 |
| Rating | 4.0 | |
You need these metrics to quantify the total power of the storm. It's not a hard concept. People may think, "Wow, this is too complicated!" But think about it. How much damage did Katrina cause? $125 Billion.
Example 2
So what was the total damage from Sandy? $68.7 billion, the 7th costliest on record. That is due to the large area of high winds and its energy driving so much water into the coast. For every category, the damage roughly increases tenfold. How is a Category 1 on Saffir-Simpson scale half as costly as Katrina? It should be much, much less, even taking into consideration regional differences in cost of living and density of housing.
So let's dig into the Power & Impact scale, and you can see why Sanday was so damaging. So what was Sandy at landfall?
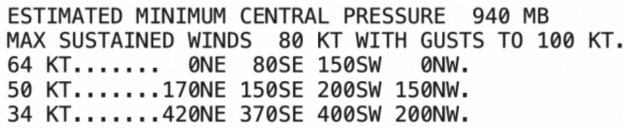
| Hurricane Sandy (2012) | ||
| Variable | Estimate | P&I Level |
| Maximum Sustained Winds | 90 mph | 1.6 |
| Maximum Wind Gusts | 115 mph | 2.9 |
| Radius of Hurricane Force Winds | 230/100 | 2.3 |
| Radius of 50-kt Winds | 670/150 | 4.5 |
| Radius of Tropical Storm Force Winds | 1390/200 | 7.0 |
| Minimum Pressure | 940 mb | 4.0 |
| Pressure Tendency at Landfall | - | 0.0 |
| Rating | 3.7 | |
Wow, look at those last two wind radii! Do you realize how much energy is involved in producing that and what impact it has on raising the ocean?
So think about how Sandy was a Category 1 on the Saffir-Simpson Scale, and Katrina, with her first hit, was also a Category 1? Which storm, using a scale with more metrics, would indicate which had the most power and therefore the greater impact? Suppose the levees had held in New Orleans, then Katrina's damage would likely have been less with its second hit and just a bit over Sandy's. Notice how the Power & Impact scale would have led to that conclusion in the first place.
Example 3
Let's also look at Hurricane Charley (2004), a fist of fury over a small area. There were huge differences between Charley, Katrina, and Sandy. On the P&I Scale, there is a difference, as Charley had Level 4 winds and pressure but the wind extent was tiny.
| Hurricane Charley (2004) | ||
| Variable | Estimate | P&I Level |
| Maximum Sustained Winds | 150 mph | 4.8 |
| Maximum Wind Gusts | 175 mph | 5.3 |
| Radius of Hurricane Force Winds | 60/100 | 0.6 |
| Radius of 50-kt Winds | 135/150 | 0.9 |
| Radius of Tropical Storm Force Winds | 240/200 | 1.2 |
| Minimum Pressure | 941 mb | 4.0 |
| Pressure Tendency at Landfall | -24 mb/6 hours | +3 |
| Rating | 3.3 | |
Notes
This is the updated scale in 2025, which I have been working on since 2008. Other categories may be added at a later time when more research is done. Storm surge, for instance, which responds to the wind and coastal variations, is something being considered. Rain has to be separate since it involves non-wind parameters. In that case, the slower a storm moves, the greater the rain totals, but this scale was developed to add additional parameters to describe more precisely the total power of the storm, separate from the rain.
Note, the Major Hurricane category starts at P& I 2.5, and we can achieve categories higher than 5 because we use tenths. This is very difficult to achieve since the storm would need to have quite a large wind extent.
Developed by Joe Bastardi
Edited by Thomas E. Downs, V
Special Contributors: Antonio Riggi and Steve Hallett
Last Updated on October 13, 2025