August 1 Hurricane Season Update 2 years ago
August 1, 2021
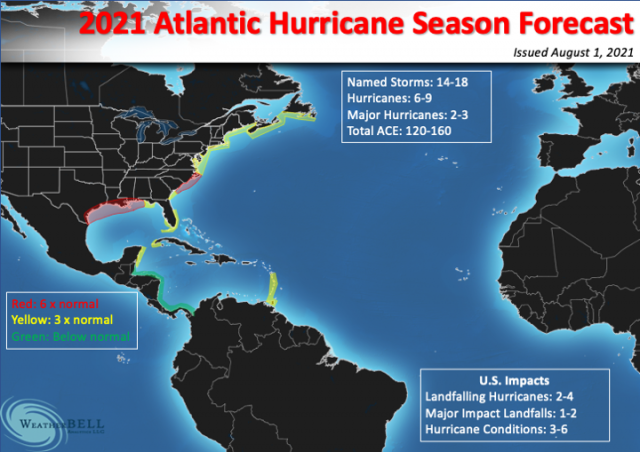
- The forecast numbers have been lowered, but still a high impact season on the way.
- The impact areas are back to what we had in the April outlook.
- The MJO is not as favorable as last year but still will favor two rotations into the favorable phases, including in the next few weeks.
Named Storms: 14-18
Hurricanes: 6-9
Major Hurricanes: 2-3
ACE: 120-160
U.S. Landfalling Hurricanes: 2-4
U.S. Major Impact Landfalls: 1-2
U.S. Hurricane conditions: 3-6
For the entire basin, I think that the overall storms will be relatively stronger than normal outside of the Main Development Region (MDR). The naming frenzy, combined with warm water farther to the north, will tend to pull the mean area to the north.
I added another category back in April - hurricane conditions. This is because a storm can stay offshore and still blast someone with a hurricane. The definition of landfall is a single point, but storms are not single points. If you are in the eyewall for 12 hours, even if the storm stayed offshore (this has happened quite a lot around Cape Hatteras and can happen with a stalling storm that is paralleling the coast nearby), then you could be having hurricane impacts without a technical landfall. A great example of this, perhaps the best, was Saffir-Simpson Category 4, Helene, in 1958, staying offshore but still causing major hurricane impacts on the North Carolina coast. That produced Cape Fear's strongest gust on record.
While I expect plenty of recurves and northern Atlantic spinups, a more pronounced cluster of tracks may develop. So the Windward Islands will have higher than average activity. Otherwise, the main tropical development areas and islands will be near normal. The only place with below normal conditions will be in the area of Central America that was devastated last year.
The reason for the reversion to the impact areas is that the strongest analog years produced these hits from August on:
.png)
You can see the Upper Texas and Louisiana coasts are a prime target.
The red areas represent a risk of more than 6 times the normal impact. Yellow is 3 times and green is below normal. For example, this means that if the average impact per year in an area is Saffir-Simpson 1.5 (all the years and see what the total rating is at landfall and divide by those years), then that area highlighted in red should get a total of 15. It can occur in multiple storms. Since this example would imply a total of 9, it means it is highly likely a major or two will hit there. Like using a normal snowfall and temperature to compute deviation from average, you must also look at the specific area, as those places to the northeast don't get hit as much as the Gulf Coast. I will use last year as a quick and dirty example of what I am talking about. Let's take the western Gulf of Mexico outlined in the red from last year's impact forecast:
.png)
Talk about an advertisement for our ideas, look at the NOAA warning verification:
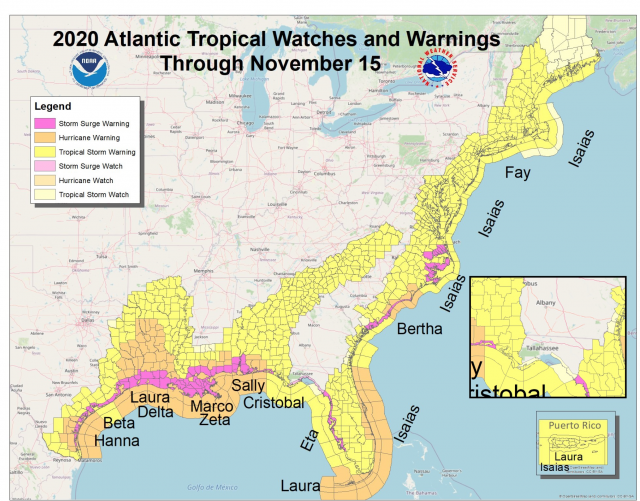
This was the activity in the western Gulf of Mexico last year:
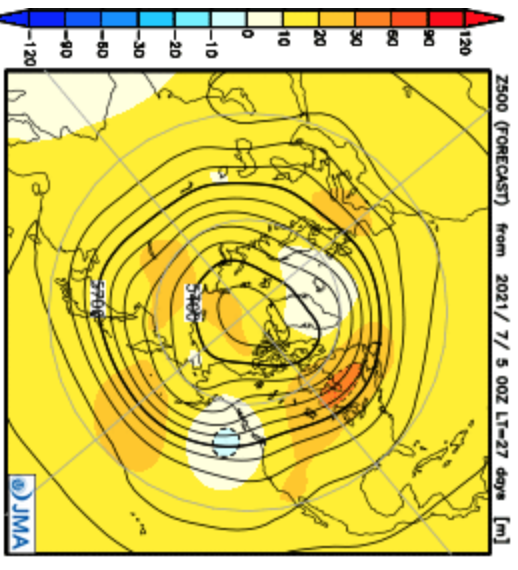
There is no change to the evolution of the overall pattern for the heart of the season. The North American pattern is still expected to produce ridging in the means over the top.
The mid-July JMA certainly described it to a "T".
The biggest impact years since 1950:
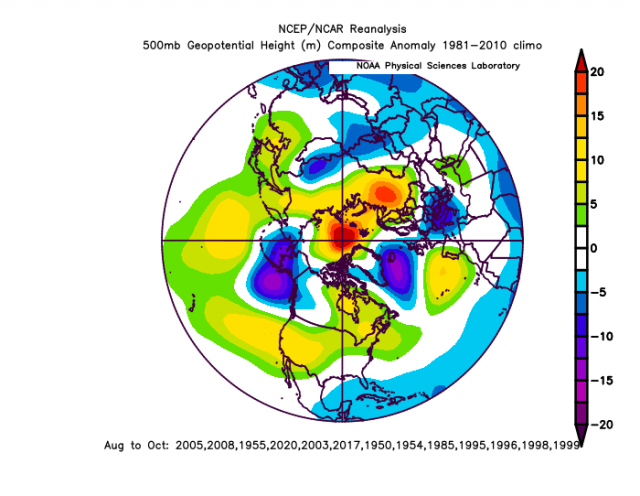
You can see that arcing ridge over the top in eastern North America. Keep in mind modeling won't be able to see the influence of the hurricanes below beforehand. The negatives you see here are because of the hurricanes, but the forecast models won't pick up on that. What the modeling is seeing is the ridge in the place where U.S. impacts have been high. With the August issuance, I have decided that we have to open up the Gulf of Mexico for as much activity relative to average (which is higher anyway), as I can see a bit more clearly now.
Now, I can home in on the MJO a bit more. There is a more coherent 40-60 day phase which has become more apparent, unlike last year where it barely got into the negative phases at any time. The last 90 days have looked like this (the red start is May):
.gif_small.gif)
This of course led to the cool air over the U.S. but then we saw it get strongly into Phases 1 & 2 before the June burst of activity occurred. In the wake of Elsa, which occurred at the tail end of that, the basin shut down as we went through Phases 4-6. We are coming around again.
.gif)
This means an active August is in store. Right off the bat, I am worried about a mid-August hurricane in the Gulf of Mexico, as I have opined in recent tropical updates. A lesser period should follow in September, but relative to average (at the peak of the season there is likely to be a storm even in unfavorable phases). Then we will ramp it back up again for the last part of the season.
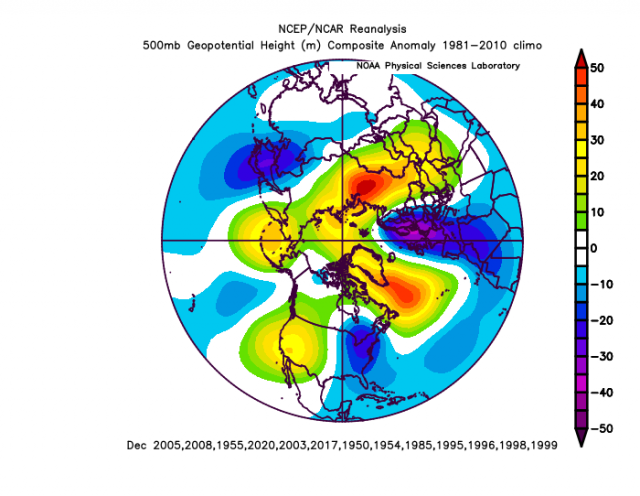
What is interesting, and though not associated directly with the Tropics, is the linkage to early winter. Assuming another rotation in later September or October, 40-60 days would then put us in December. The same phases favorable to hurricane activity in that season are the cold phases in winter. So the very strong hyper-spring MJO, the cold May, higher impact hurricane season 500 mb pattern (above), produces this for December:
Here is the forecasted pattern for August-October on the JMA:
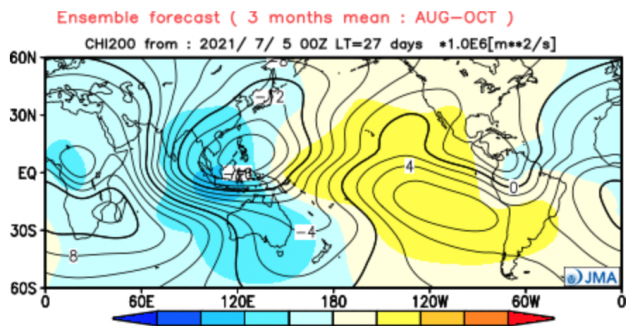
This is quite similar to last year:
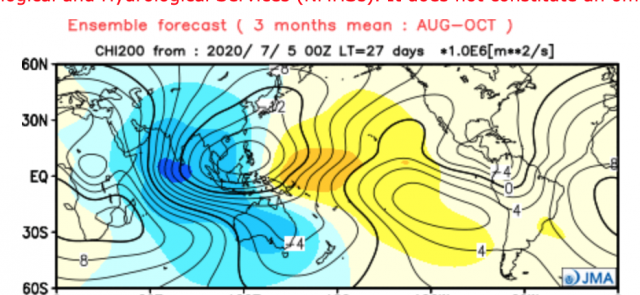
It was a bit more bullish in 2020, as it solidly centers the strongest indicator in Phase 2. So it's similar (not the same), but given we had a record-breaking impact year last year, it still looks like it will be above-average with similar targeting.
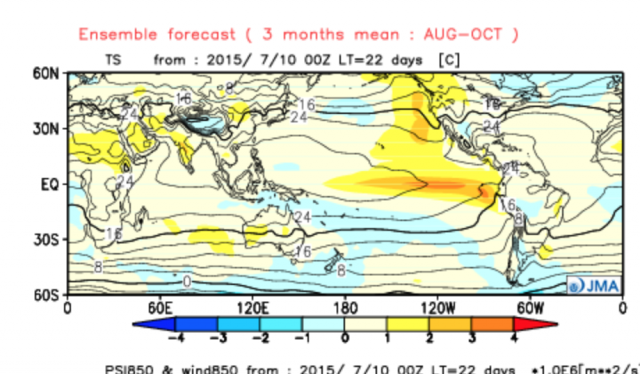
This is still the opposite of a very inactive year like 2015:
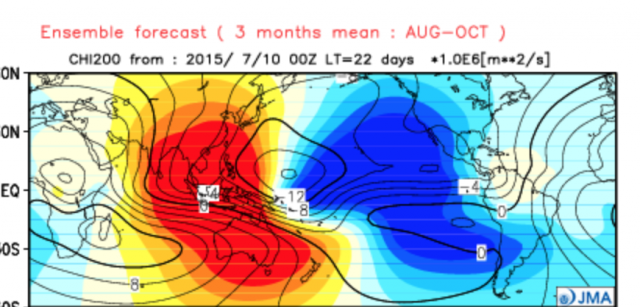
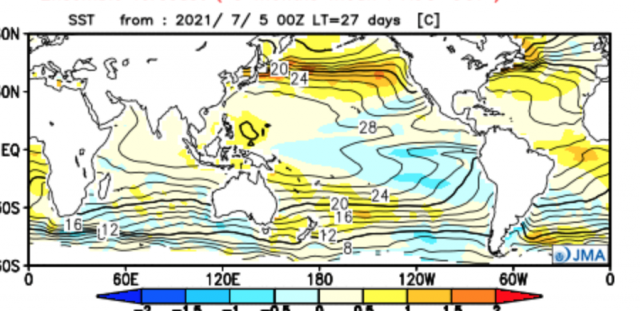
The SSTs are less bullish though. This year:
2020:
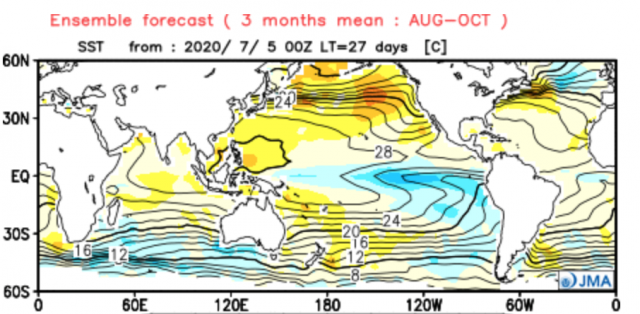
It looks like a dumbed-down version of last year, but still the opposite of an inactive year like 2015:
Since this is an update, a lot of the extensive preseason writings can be referred to for more information. This is designed to hone the forecast with some pertinent new information. Most important is the MJO, which will give us the chance for two major periods of impact in the U.S., and one is not far off this month.
The Verdict
I lowered numbers and reverted the impact areas to what we had in April, increasing it back over the Gulf of Mexico and leaving the Carolinas as the target in the East. The shortcut storm for the East Coast, as alluded to in the previous forecast, is still very much alive and kicking. Given the landfalling ones such as Hugo, Isabel, 1933, 1903, and Florence (there are others but not so much) are rarer than the sweeping arcs near and off the East Coast, I am curious from my own view as to whether this has any merit. I think on the East Coast we will have one like that to deal with, which is rare (again a storm hitting from an east of south direction north of 32°N (that's where the coast starts bending back to the northeast). A classic storm from the south is still also a possibility, but this looks a lot like an August when the Gulf of Mexico is going to be the focus.
Noes and Asides
Previous tropical updates last week and before have dealt with the helplessness of modeling with the MJO, which I think we have been doing a good job of picking out. This means I can hardly use the Euro, given its MJO forecasts that carry no linkage to the real-world results that are in the paper their own expert put out. Quite frankly, this is a must-read, as there is enough easy to see information that it can help in our communication with the forecasts if you are aware of it:
https://agupubs.onlinelibrary.wiley.com/doi/full/10.1029/2009GL039089