May 2020 Hurricane Season Update 3 years ago
May 7, 2020
- There are many similarities to some notable hyperactive seasons.
- A warm Atlantic Basin is already in place and no El Niño is expected.
- Weighting analogs points at highly active seasons.
- New Euro seasonal shows favorable MJO precipitation pattern for enhanced activity around North America.
- Euro ACE still under average but highest of last 4 years
- Our expectations of a big-ticket season have not changed from our March 10 outlook.
.png)
WeatherBell has been a pioneer in identifying the areas most susceptible to tropical cyclone impact during the preseason. Last year's forecast showed the area where the ACE (accumulated cyclone energy) would be below normal but did not identify the above normal areas because the signal was quite weak for the first time in three years. So we forecasted a scattershot season, which I think we can agree we had.
For the current year, a higher number of storms and ACE is supported by very warm Atlantic and Gulf SSTs, and the fact that many storms we could not see years ago are now seen and named with improved satellite instrumentation. In addition, very warm water near the coasts ups the ante for rapid feedback development. This is how we caught Imelda last year, and it's fortunate the process waited until it was on land.
In April we identified the areas we believe are at greatest risk for impacts. The danger of the current idea is the same kind of thing that thwarted the winter forecast (making a forecast off a forecast), but the forecasted SSTs are in line with hyperactive seasons.
The SST forecast has changed little. The CFSv2 forecast from early March:
.gif)
The latest:
.gif)
Notice how warm spots globally are not as warm. This is because the model goes over the rails with warmth in the longer terms (they can see warm, but not cold). However the areas of general warmth and cold are good.
A La Niña does not mean we have to have a big season. The Euro is a bit drier with its latest idea.
.png)
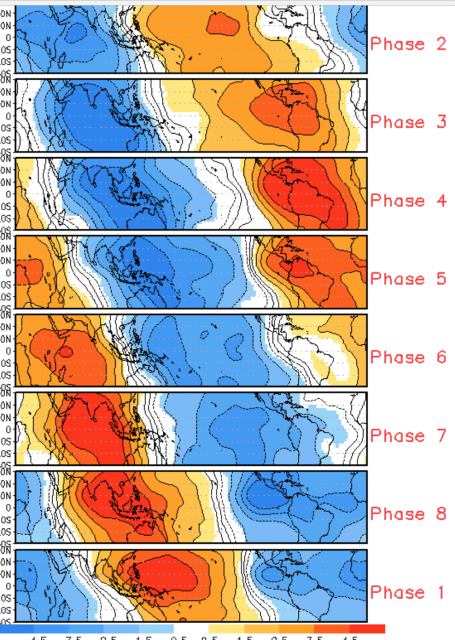
This closely correlates to Phases 2 & 3 of the MJO:
.png)
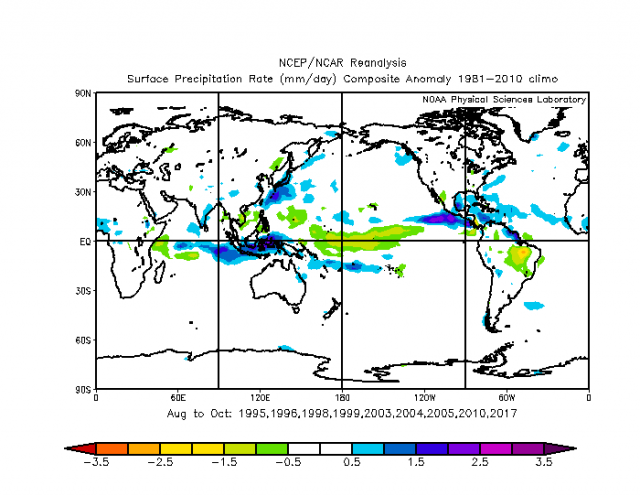
The precipitation pattern during the 8 hyperactive seasons:
Phases 2 & 3 give us this according to Vitart, et al.
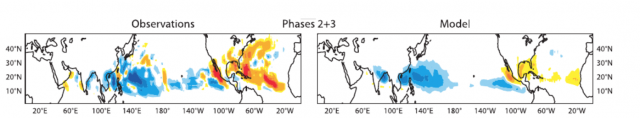
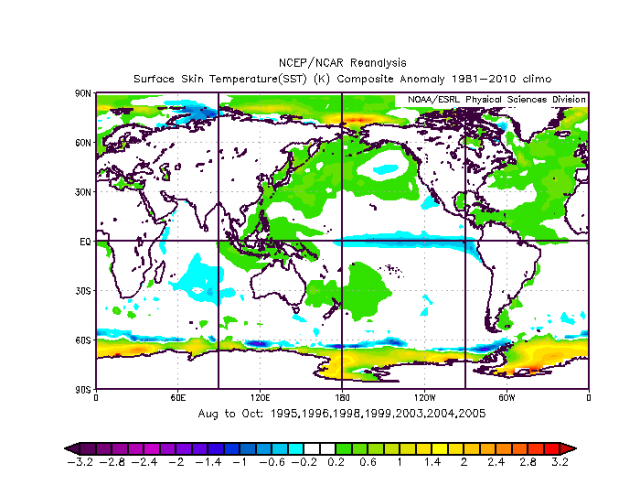
Notice that modeling forecasts less than what actually happens, which may be why the Euro is dragging its heels on total ACE. The latest forecast is for 80% of normal, actually down from April but more than the previous years. Based on the modeling's expectations, it would underpredict in Phases 2 & 3, and would likely miss storms way out at sea. The hyperactive seasons of 1995, 1996, 1998, 1999, 2003, 2004, and 2005 had the warmer SSTs in the tropical Atlantic with the cooler (less warm) waters off the Southeast Coast.
The 2010 and 2017 hyperactive seasons:
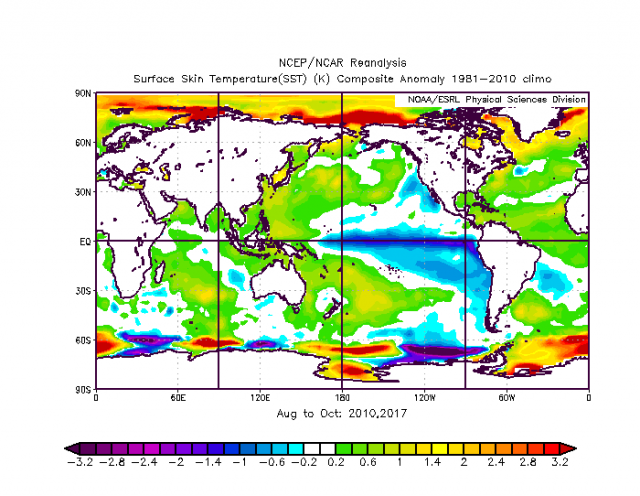
These were more like what we are seeing now, with more widespread warmth. There are also some similarities to 2007 and 2013, which wound up with near to below normal activity.
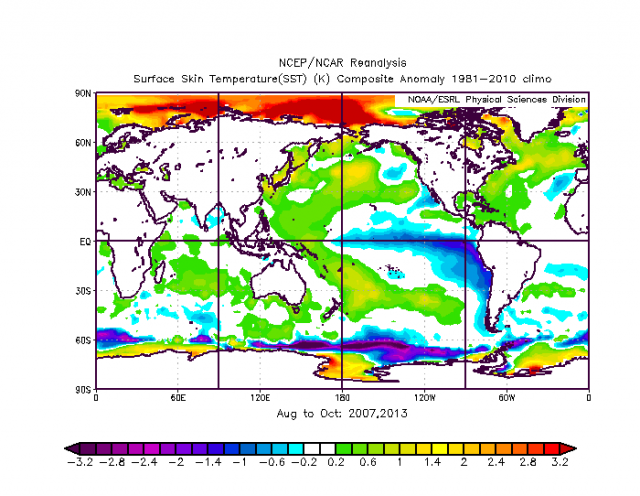
In fact, an argument can be made that those years could be the closest to the SST forecast.
Certainly, the JMA upward motion chart for the summer season remains similar:

It matches the upward motion for those more favorable phases of the MJO:
Now the big danger of course, like the past winter, is making a forecast off a forecast. However, there are physical reasons now indicating the models are onto something. The cooling continues in the tropical Pacific:
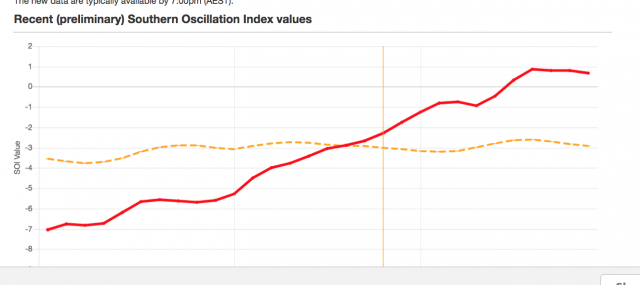
Ths SOI is turning up:
The colder water is coming to the surface:
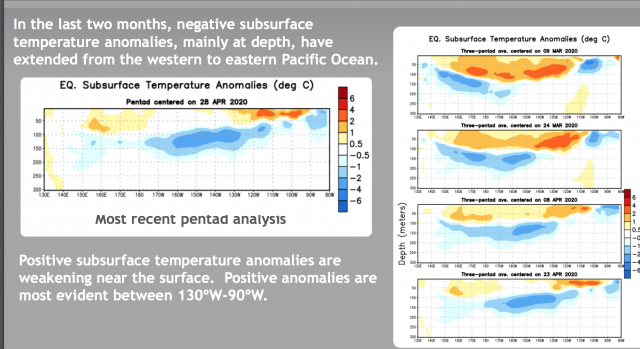
We are seeing a big change in the MJO forcing, favoring the southern parts of the Western Hemisphere rather than the northern parts of the Eastern Hemisphere. Those are warm phases in winter and tend to limit tropical activity during the hurricane season.
So the analog years we are looking at are:
| Year | ACE | Named Storms | Hurricanes | Intense Hurricanes |
| 1995 | 227 | 19 | 11 | 5 |
| 1996 | 166 | 13 | 9 | 6 |
| 1998 | 182 | 14 | 10 | 3 |
| 1999 | 177 | 12 | 8 | 5 |
| 2003 | 177 | 16 | 7 | 3 |
| 2004 | 227 | 15 | 9 | 6 |
| 2005 | 250 | 28 | 15 | 7 |
| 2007 | 74 | 15 | 6 | 2 |
| 2010 | 165 | 19 | 12 | 5 |
| 2013 | 36 | 14 | 2 | 0 |
| 2017 | 225 | 17 | 10 | 6 |
| Average | 173 | 16.5 | 9 | 4.4 |
Landfall chart of hurricanes and intensity in these years:
Given the precipitation and pressure patterns, the hints are there.
About 25 hurricanes hit the U.S. in the analog years with about half of them being major storms. So 2-3 landfalling hurricanes, with 1 or 2 being major hurricanes is the current idea. There are four areas that were targeted in the analog years: Texas, the central Gulf Coast, southern Florida, and the North Carolina Outer Banks. None in these years broke out of the pack and hit New England, and you have to wonder how long that can be the case, though we did have a weakened Irene and Sandy in non-analog years.
The Verdict
The danger of making a forecast off of a forecast is there, along with the possibility of a year where next to nothing happens despite great similarities to the hyperactive years. For now, we have high totals because of the similarities to the hyperactive years.
With the warm Atlantic Basin SSTs already in place, no El Niño, and an upward motion forecast that looks like a favorable MJO pattern for the hurricane season, the outlook for a big season in 2020 remains. We can have big seasons like 2010, where next to nothing hit land, but chances are staying in the middle like we are doing would serve us well.
The European still less than average means I won't increase the totals. However, I think a lot of that maybe that it only looks at deep tropical development and not the more numerous storms that we see getting named today. Since the last outlook, several other forecasters have come out in the basic agreement of our idea
Notes and asides
The discussion about our Power and Impact Scale can be found in forecast discussions from previous years.