April Hurricane Season Outlook 4 years ago
April 8, 2019
- No big changes from March's outlook.
- Slight change in the number of major hurricanes partly because of a tendency to classify storms based on satellite rather than recon that are far out (which several may be this year)
- Scattershot track season, but lower than average activity is expected in the Main Development Region.
- Surface pressure analogs on Euro indicate a weaker year than our forecast.
Total Storms 10-15
Hurricanes: 4-7
Major Hurricanes: 1-3
ACE: 60-110
WeatherBell has been the pioneer in landfall impact ideas and usually I light up the map with areas to look for the greatest activity relative to normal (and also less than normal). As of this writing I think the season is scattershot enough so that I am identifying areas where I think the ACE will see well below normal activity. The rest of the map will be closer to Climatology.
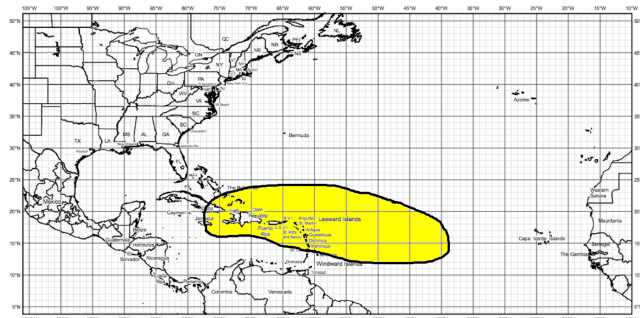
Certainly a strong individual track would create a higher ACE value close to where the storm track is. However, I can't draw a conclusion over a large area where we should look for the strongest activity. The water is very warm near our coasts again, and so there is the threat of spin up storms that can come onshore while near their peak.
The large area of high pressure over North America for the season is unlike the years, which we have shown on previous outlooks, where storms weakened off their peak. That being said, the Euro pressure forecast is most similar to a blend of years that were near or below the bottom end of our ACE range.
We have increased the major hurricane range to 1-3. This is because NHC may declare a small storm a major hurricane based on satellite imagery, like it did with Danny a few years ago (a storm less than 100 miles wide that briefly hit Category 3). In the pre-satellite era, Danny would not have been a major hurricane unless a ship happened to wander through it or it went directly over a data buoy. This is a not a knock on NHC; they simply tell it like it is and since we can now see things like that we must adjust. That being said, the large area of yellow in the map above across the Main Development Region portrays my belief of a weaker than average year like last year in the deeper Tropics. Keep in mind that 2015 was weaker than average but Joaquin went wild near the northwestern side of where I have the yellow.
The SST forecast still indicates warmer than average SSTs near the U.S. coast and a diminishing El Niño, but one that is still present.
The surface pressure pattern is closest to a blend of 1976, 1977 and 1982.
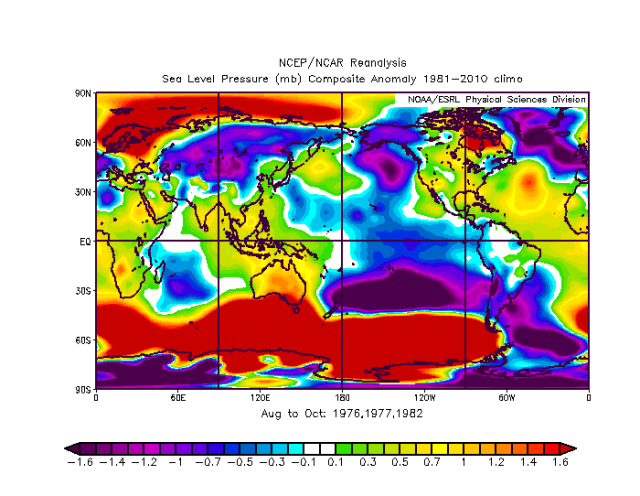
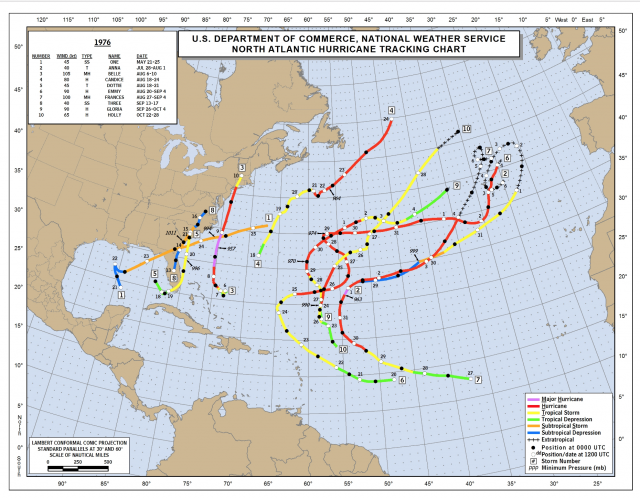
That is darn close to the Euro in the Atlantic, and even in the Pacific. Those seasons saw below average activity. 1976:
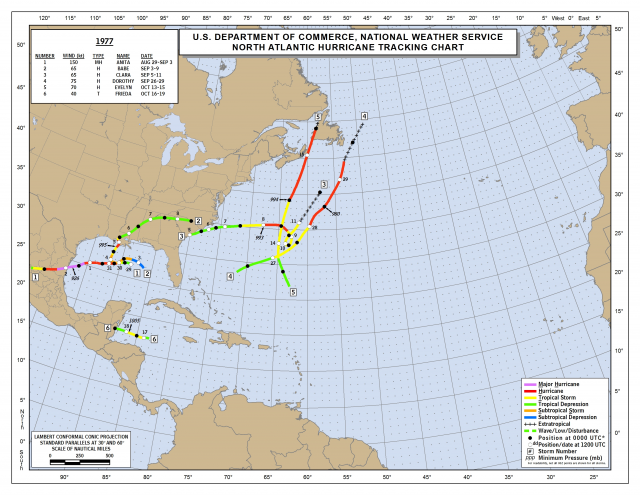
1977:
1982:
.png)
Notice the randomness of these seasons with lack of major development over the Deep Tropics. Belle in 1976 faded coming up the coast, but with the same kind of storm this year over much warmer water it could be a bigger problem. Anita in 1977 in the Gulf of Mexico went to a Category 5 but was driven west-southwestward into Mexico. Still the activity in all those years were below average, with 1977 and 1982 below our lowest limit of the range.
However, there is a lot of high, not low pressure, over the U.S. There is a weakness in the pressure pattern in the northwestern Atlantic, making me wonder if the pattern might be conducive there. Overall it is not a very bullish look.
The Verdict
From this point of view it looks like a down year in at least the Main Development Region and less of a year farther to the north than last year. The caveat is that in-close systems and warm water feedback will lead to challenges that can make or break the season from an impact perspective. On the high end, if the El Niño isn't impressive we could see activity in line with last year, hence the relatively broad range. I have a feel for where below average intensity of storms relative to normal will be, but the term "scattershot" describes the idea of stronger features away from the Deep Tropics this year.